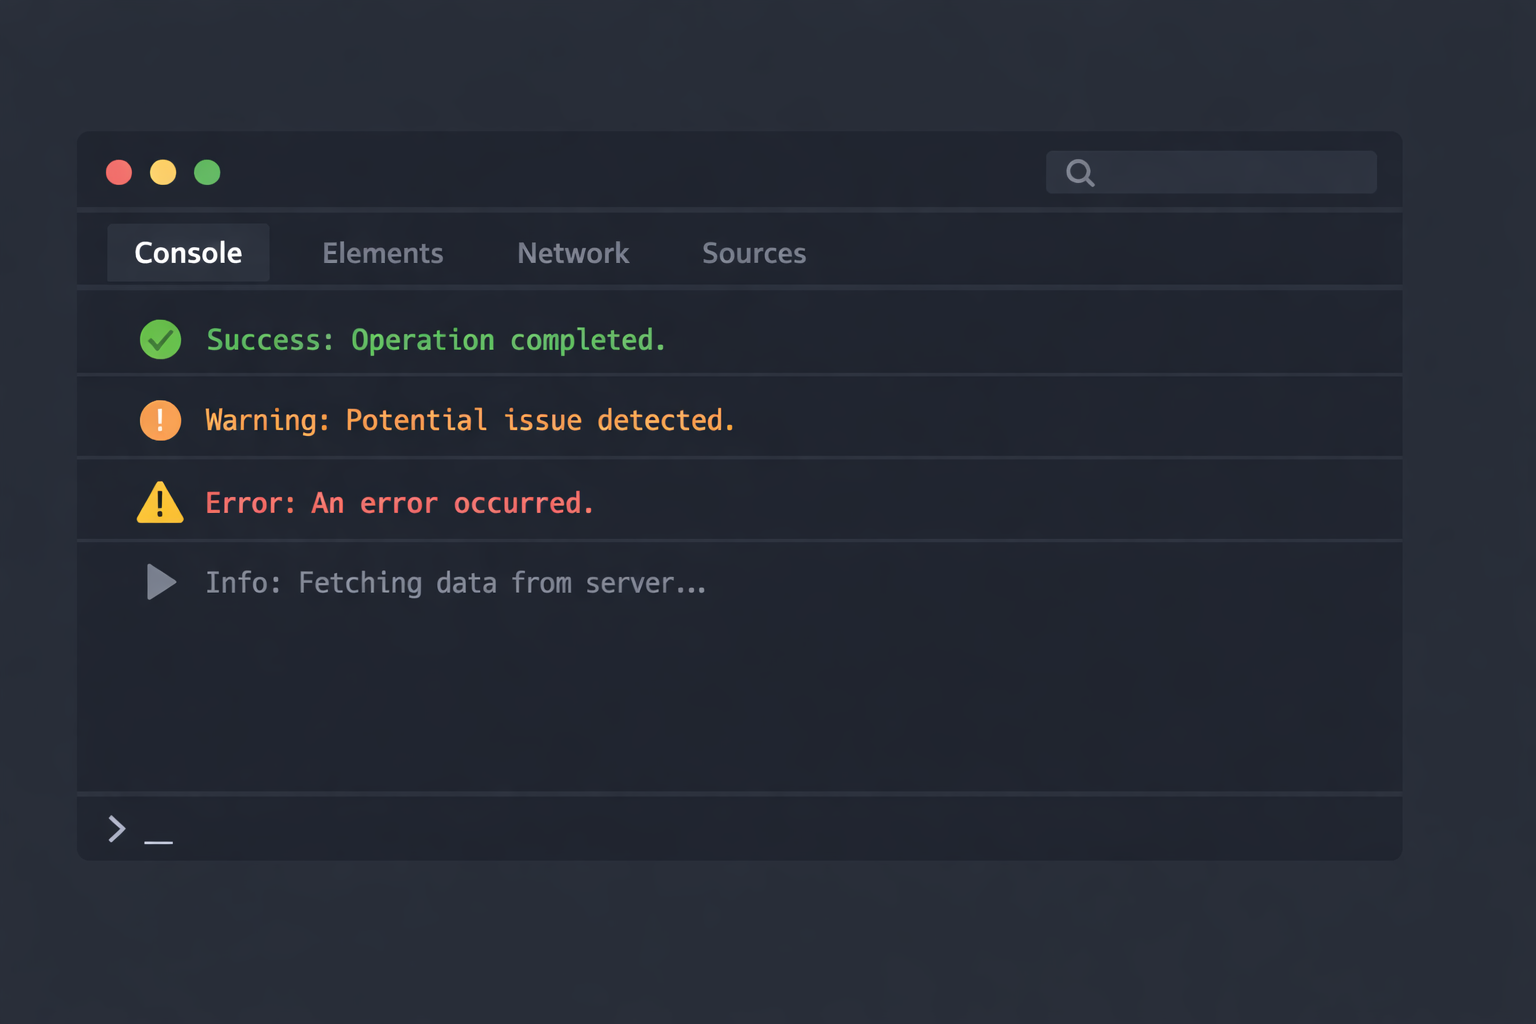
An already open tool
When a bug shows up in the browser, my first reflex is not to open a heavy debugging tool. The console is already there. Often open, otherwise just a couple of clicks away.
Over time, it has become my default entry point to understand what is happening in a web application. Not to check that “something logs”, but to look at real values while the code is running.
The console’s reputation
The console often comes with some baggage. It is usually linked to random console.log calls, left in the code, or added without a clear reason.
The issue is not the console itself. Most of the time, it is about logging without thinking. A log without intention rarely helps.
A useful log answers a specific question. Everything else is noise.
Seeing what actually happens
What I like about the console is that it lets me watch the code run without stopping everything. No need to freeze execution everywhere just to get a first understanding.
It makes it easy to check:
- when a function is called
- with which exact data
- in which order things happen
In many cases, this is enough to spot where things go wrong, especially when state changes quickly or multiple events overlap.
A stable tool in changing contexts
As an independent developer, projects often change. Different stacks, different constraints, sometimes very quickly.
The console stays the same. It works regardless of the framework or the project. That makes it a simple and reliable tool.
Why start here
This blog starts from a simple idea: the console is not a fallback tool. It is a proper working tool.
Used well, it helps avoid over-engineering too early and makes it easier to understand what the code actually does 🙂

